


Power Quality for Data Centers
Measure at the main incomer, UPS AC input and cooling drive input. Use those readings to assess feeder-level harmonic filtering and dynamic reactive compensation on the main bus.
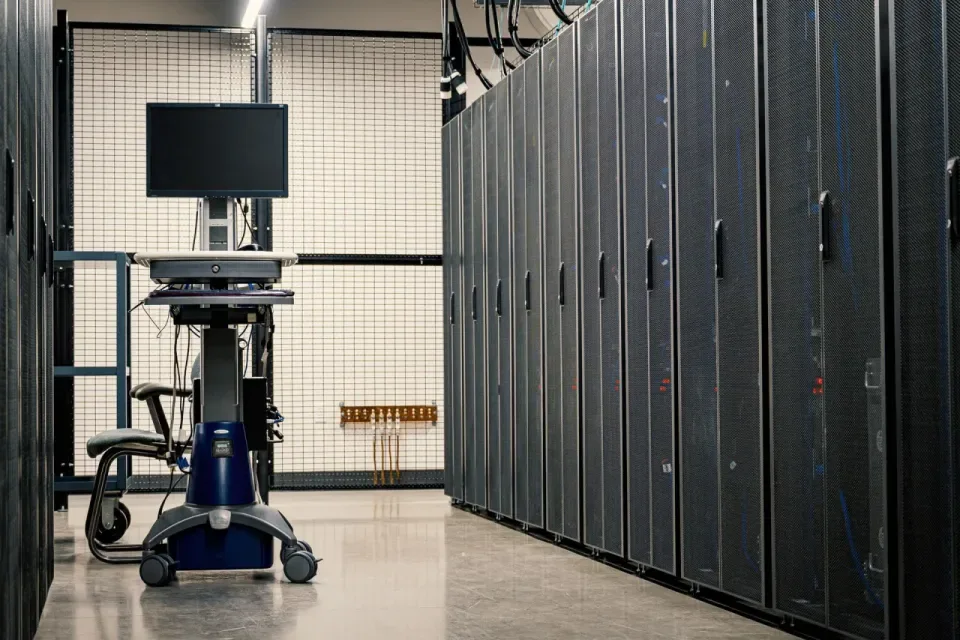
Data center reference configuration
In this example, the UPS input meets the project target, cooling drives dominate harmonic current, and reactive demand varies at the main bus. Evaluate feeder-level AHF and bus-level SVG, with an analyzer for the baseline and commissioning checks.
- UPS input feederMeasure at the AC input · supplies IT loads via UPS
- Cooling drive feederMeasure at drive input · evaluate shunt AHF
- Bus compensation branchSeparate shunt SVG where justified by measured kVAr
Distribution and compensation referencesSchneider Electric · Data center reference designEaton · Data center harmonicsCIRCUTOR · Static var generator manual
- Online Power Quality Analyzer
Measure the incomer and two feeders
Record voltage distortion, harmonic current by order, kW, kVAr and power factor at the LV incomer, UPS AC input and cooling drive input. Compare representative light and peak loads on each supply path.
- Sucyc-AHF Active Harmonic Filter (IGBT)
Evaluate an AHF on the cooling feeder
If the measurements locate the dominant harmonic current on the cooling feeder, evaluate a shunt filter there. If several feeders contribute, compare bus-level filtering. Size from the harmonic current to compensate and review the current transformer measurement boundary.
- Static Var Generator (SVG)
Evaluate an SVG on the main bus
Where fundamental reactive demand varies with load, use the measured kVAr profile to assess dynamic compensation. Review existing capacitor banks and utility or generator operation, especially the risk of leading power factor at light load.
How to verify the result
- Harmonics
- Compare voltage distortion and targeted harmonic currents before and after mitigation at the same measurement points, with the same supply mode and comparable load. Evaluate compliance at the applicable point of common coupling (PCC).
- Reactive power
- Check kVAr and power factor through representative light-load and peak-load periods. Review leading and lagging behavior in the agreed operating modes.
- Operation and transfer
- During the approved commissioning window, check alarms and coordination with the UPS, backup supply and existing compensation. Record transfer events separately from steady-state measurements.
Harmonic limits at the PCCIEEE 519
Related guides and applications
Prepare a project enquiry
- Single-line diagram with A/B supply paths, transfer equipment and candidate connection points
- Main and feeder measurements, harmonic spectra and the reactive power trend
- UPS, cooling drive and existing compensation equipment details